Physical Address
304 North Cardinal St.
Dorchester Center, MA 02124
Physical Address
304 North Cardinal St.
Dorchester Center, MA 02124

No time to read?
Click below to listen to our podcast on Data Quality.
In today’s data-driven business landscape, the quality of your data can make or break your decision-making processes. Poor data quality can lead to misguided strategies, inefficient operations, and missed opportunities. But how do you ensure your data is up to par? That’s where data quality metrics come in.
Data quality metrics are quantifiable measures that help you assess the health and reliability of your data. By tracking these metrics, you can identify issues, set improvement goals, and ultimately enhance the overall quality of your data assets.
In this comprehensive guide, I am going to explore the 10 essential data quality metrics that every business should be tracking. I will dive into what each metric means, how to calculate it, and why it matters for your business. Let’s get started!

Data accuracy is perhaps the most critical aspect of data quality. After all, what good is data if it’s not correct?
The data accuracy rate measures the percentage of data in a dataset that is correct when compared to the actual values. For example, if a customer’s address in your database matches their real-world address, that data point is accurate.
To calculate the data accuracy rate, use this formula:
(Number of accurate data points / Total number of data points) x 100Aim for an accuracy rate of at least 95% for critical data. Anything less could lead to significant errors in decision-making.
To improve your data accuracy rate:
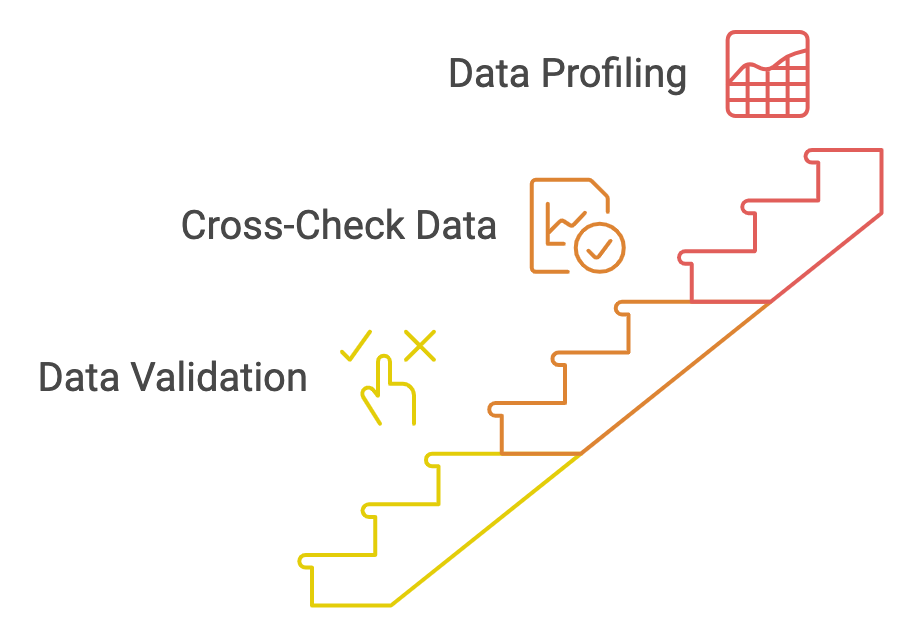
Incomplete data can lead to flawed analyses and poor decision-making. The data completeness score measures how much of the required data is present in your dataset.
For instance, if you’re tracking customer information and have 10 required fields, but only 8 are filled out on average, your completeness score would be 80%.
Calculate your data completeness score using this formula:
(Number of complete records / Total number of records) x 100Strive for a completeness score of 98% or higher for essential data fields.
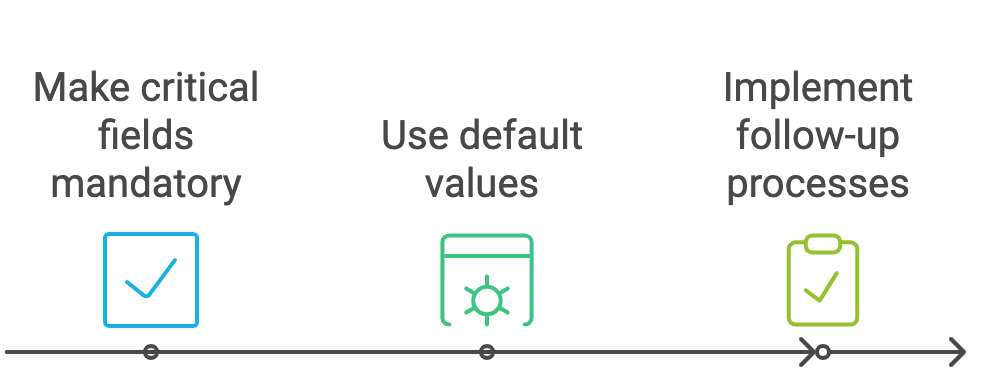
To improve your data completeness score:
Data consistency ensures that your data is uniform across all systems and databases. Inconsistent data can lead to confusion and errors in reporting.
For example, if a customer’s name is spelled differently in two different databases, that’s an inconsistency.
To calculate the data consistency rate:
(Number of consistent data points / Total number of data points across systems) x 100Aim for a consistency rate of at least 90% across your systems.
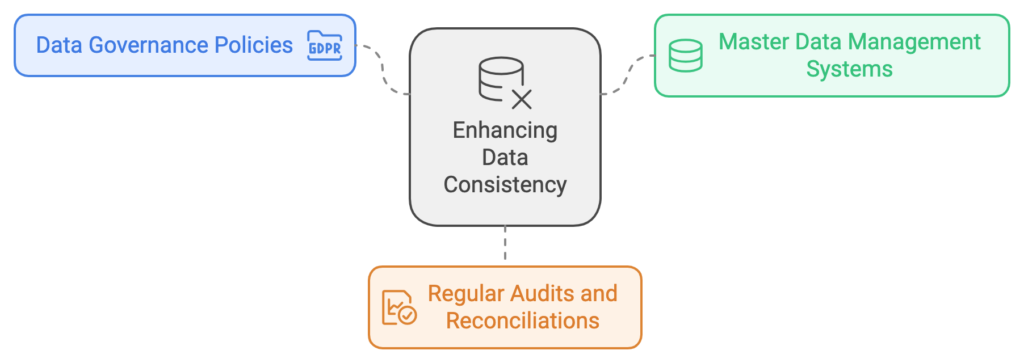
Improve your data consistency rate by:
In our fast-paced business world, outdated data can be just as harmful as inaccurate data. The data timeliness score measures how up-to-date your data is.
For instance, if you’re tracking inventory and your system shows 100 items in stock, but you actually have 90, your data isn’t timely.
Calculate your data timeliness score using this formula:
(Number of up-to-date records / Total number of records) x 100Strive for a timeliness score of 95% or higher, especially for time-sensitive data.
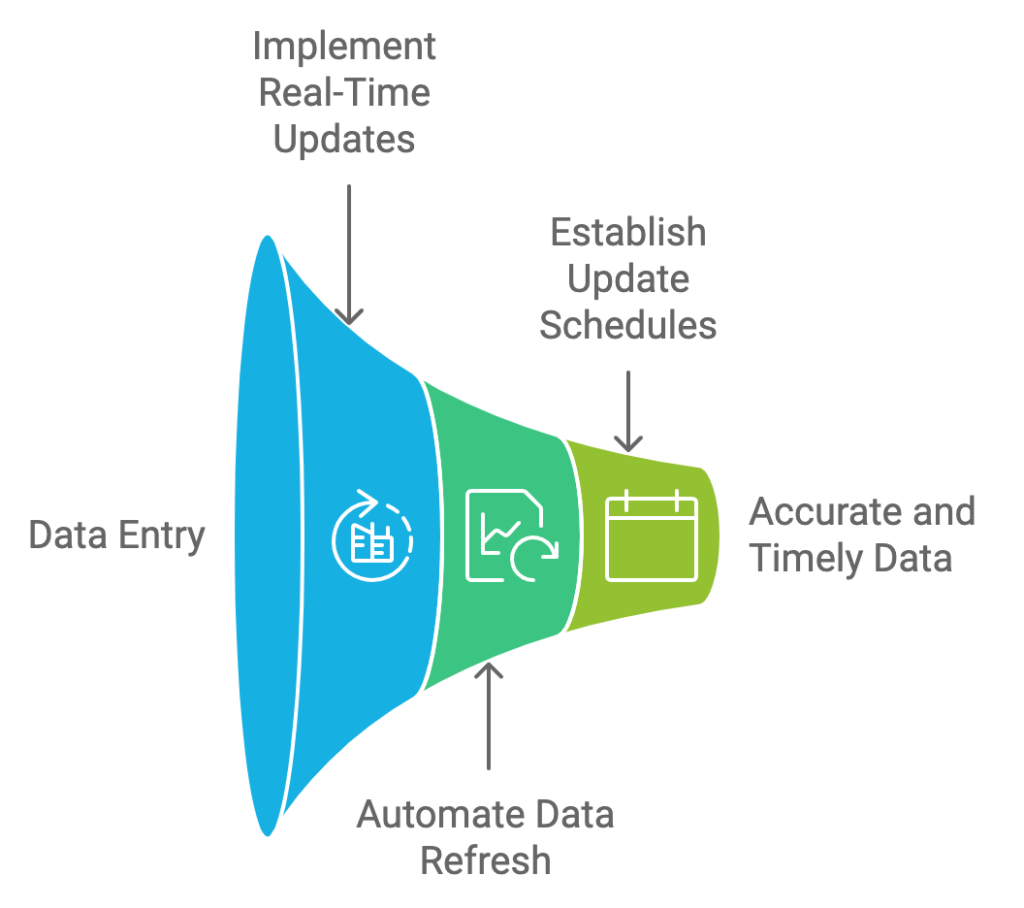
To improve your data timeliness score:
Data validity ensures that your data conforms to the defined business rules and formats. Invalid data can cause system errors and lead to incorrect analyses.
For example, if you have a field for phone numbers and it contains text instead of numbers, that data is invalid.
Calculate your data validity rate using this formula:
(Number of valid data points / Total number of data points) x 100Aim for a validity rate of at least 98% to ensure smooth system operations.
Improve your data validity rate by:

Duplicate data can skew your analyses and lead to inefficiencies. The data uniqueness score measures how free your dataset is from duplicates.
For instance, if you have two entries for the same customer in your database, that’s a lack of uniqueness.
To calculate the data uniqueness score:
(Number of unique records / Total number of records) x 100Strive for a uniqueness score of 99% or higher to avoid analytical errors.
To improve your data uniqueness score:

Data integrity refers to the overall trustworthiness and reliability of your data throughout its lifecycle. It encompasses aspects of accuracy, consistency, and validity.
This is often a composite score based on other metrics like accuracy, consistency, and validity.
Calculate your data integrity index using this formula:
(Accuracy Rate + Consistency Rate + Validity Rate) / 3Aim for a data integrity index of 95% or higher for critical datasets.
Improve your data integrity index by:
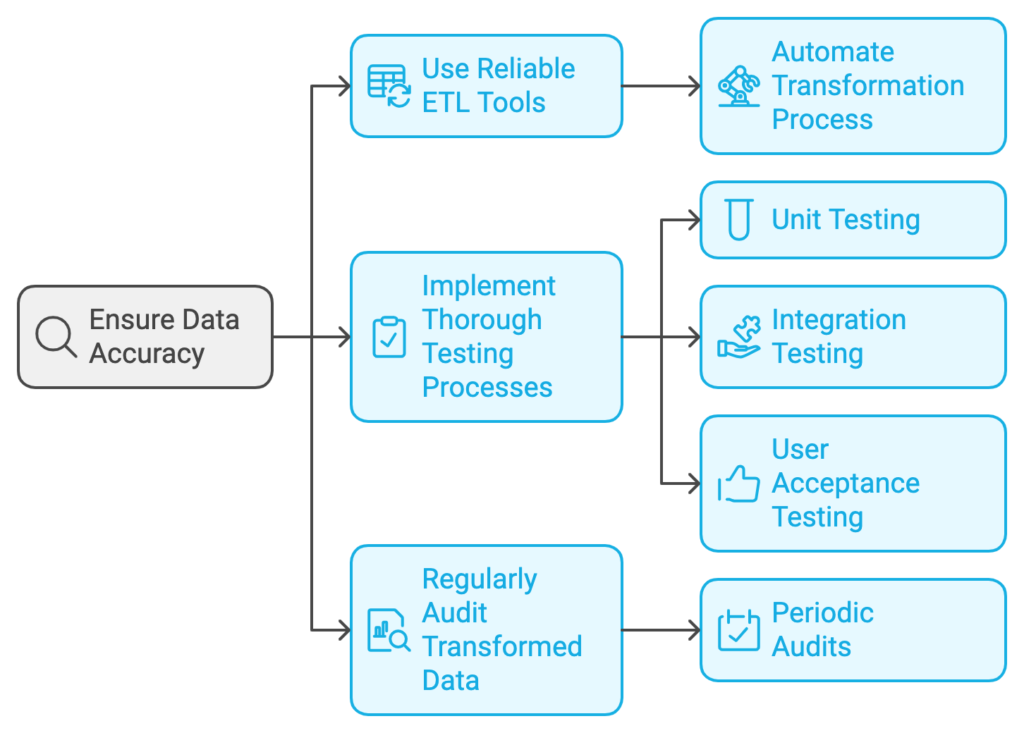
The error rate is the flip side of accuracy. It measures how often errors occur in your data.
For example, if you’re entering customer orders and 5 out of 100 orders have an error, your error rate is 5%.
Calculate your error rate using this formula:
(Number of erroneous data points / Total number of data points) x 100Strive to keep your error rate below 5% for all data, and below 1% for critical data.
To reduce your error rate:
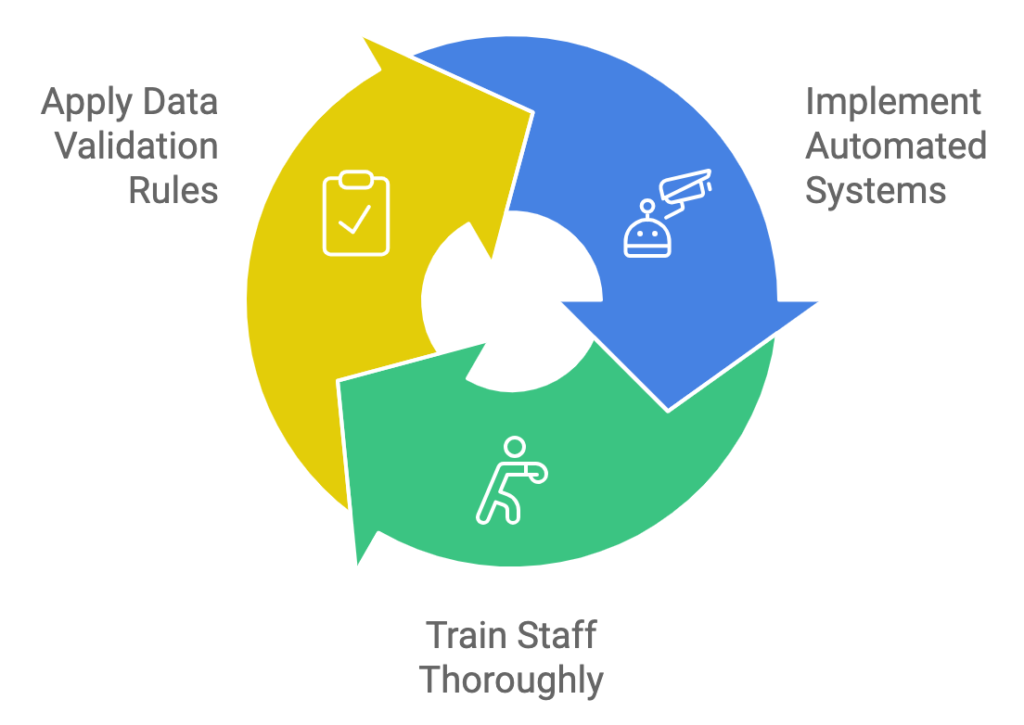
When data moves between systems or undergoes transformation (like currency conversions), errors can occur. The data transformation error rate measures how often these errors happen.
For instance, if you’re converting prices from USD to EUR and 2 out of 100 conversions are incorrect, your transformation error rate is 2%.
Calculate your data transformation error rate using this formula:
(Number of transformation errors / Total number of transformations) x 100Aim for a transformation error rate of less than 2% to ensure data integrity across systems.
Improve your data transformation error rate by:
When data quality issues are identified, how quickly are they resolved? The data remediation time measures the average time it takes to fix data quality issues once they’re discovered.
For example, if it takes an average of 2 days to correct inaccurate customer information once it’s identified, your data remediation time is 2 days.
Calculate your data remediation time using this formula:
Sum of time taken to resolve all issues / Number of issues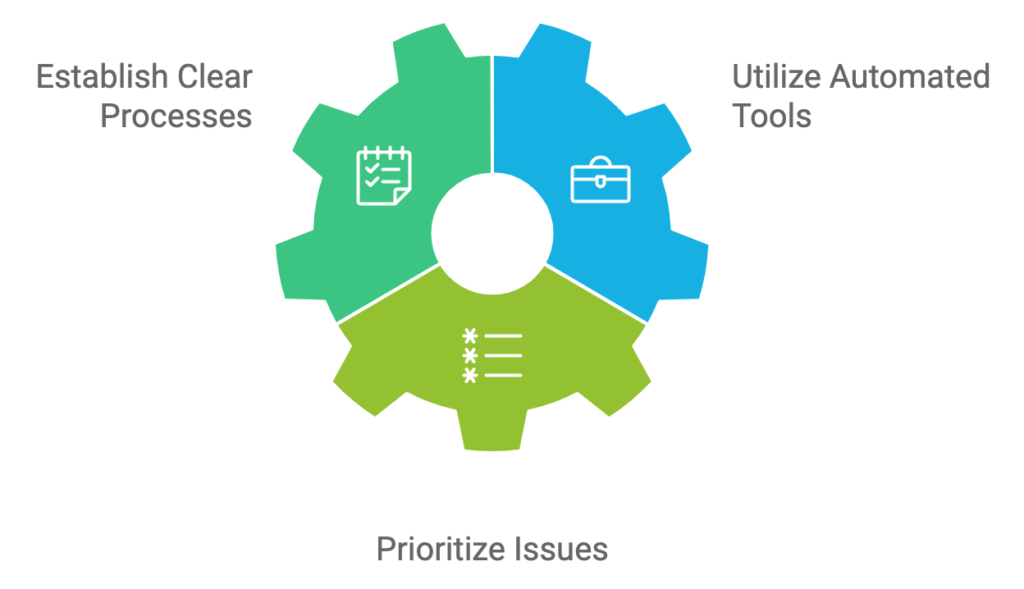
Strive to keep your data remediation time as low as possible. For critical data, aim for resolution within 24 hours.
To improve your data remediation time:
Now that I have covered the 10 essential data quality metrics, you might be wondering how to implement them in your business. Here are some steps to get you started:
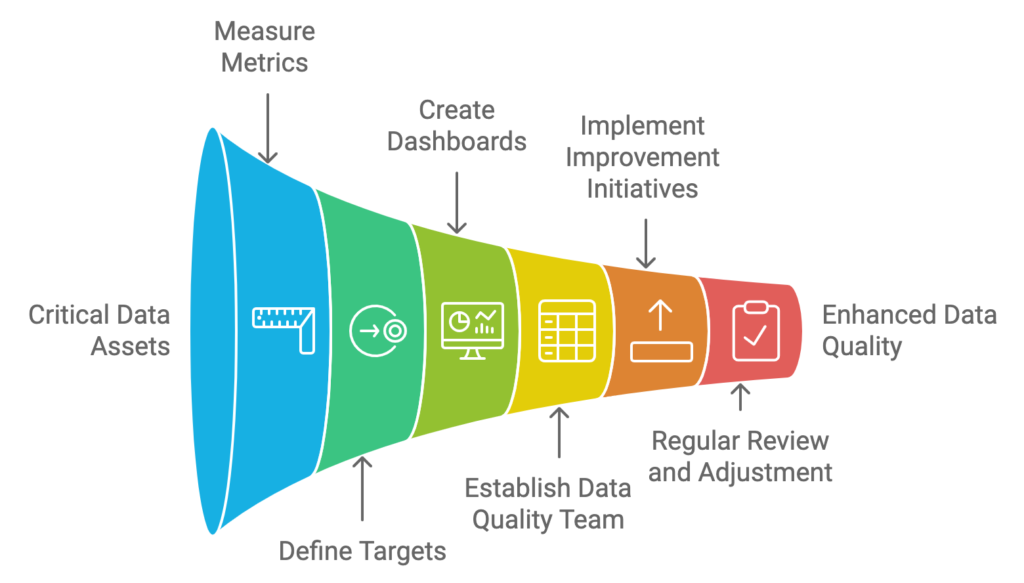
1. Identify your critical data assets: Not all data is created equal. Focus on the data that’s most crucial for your business operations and decision-making.
2. Set up measurement processes: Establish processes to regularly measure each of these metrics for your critical data assets.
3. Define targets: Based on your business needs and industry standards, set target ranges for each metric.
4. Create dashboards: Develop dashboards that visualize these metrics, making it easy for stakeholders to understand the current state of data quality.
5. Establish a data quality team: Assign responsibility for monitoring these metrics and driving improvements.
6. Implement improvement initiatives: Based on the metrics, identify areas for improvement and implement initiatives to enhance data quality.
7. Regular review and adjustment: Regularly review your metrics and adjust your targets and strategies as needed.
In today’s data-driven business environment, high-quality data is not just an asset – it’s a necessity. By tracking these 10 essential data quality metrics, you’ll gain a comprehensive view of your data’s health and be well-equipped to make data-driven decisions with confidence.
Remember, the specific targets for each metric may vary depending on your industry and the criticality of the data. The key is to consistently monitor these metrics, set improvement goals, and take action when issues arise.
Implementing a robust data quality measurement program might seem daunting at first, but the benefits far outweigh the effort. With high-quality data, you’ll be able to make better decisions, operate more efficiently, and stay ahead of the competition.
So, what are you waiting for? Start measuring your data quality today and unlock the full potential of your data assets. Your future self (and your bottom line) will thank you!